What is price absorption?
Absorption occurs when aggressive market orders hit one side of the book but price fails to continue in that direction. Large volume trades at a level without follow-through — institutions are “absorbing” the flow, often ahead of a reversal.
How XtradeReverse detects absorption
The indicator evaluates footprint clusters at the low edge or high edge of each bar in the pattern window. It checks minimum volume, edge percentage, close rejection from the extreme, and optional delta confirmation.
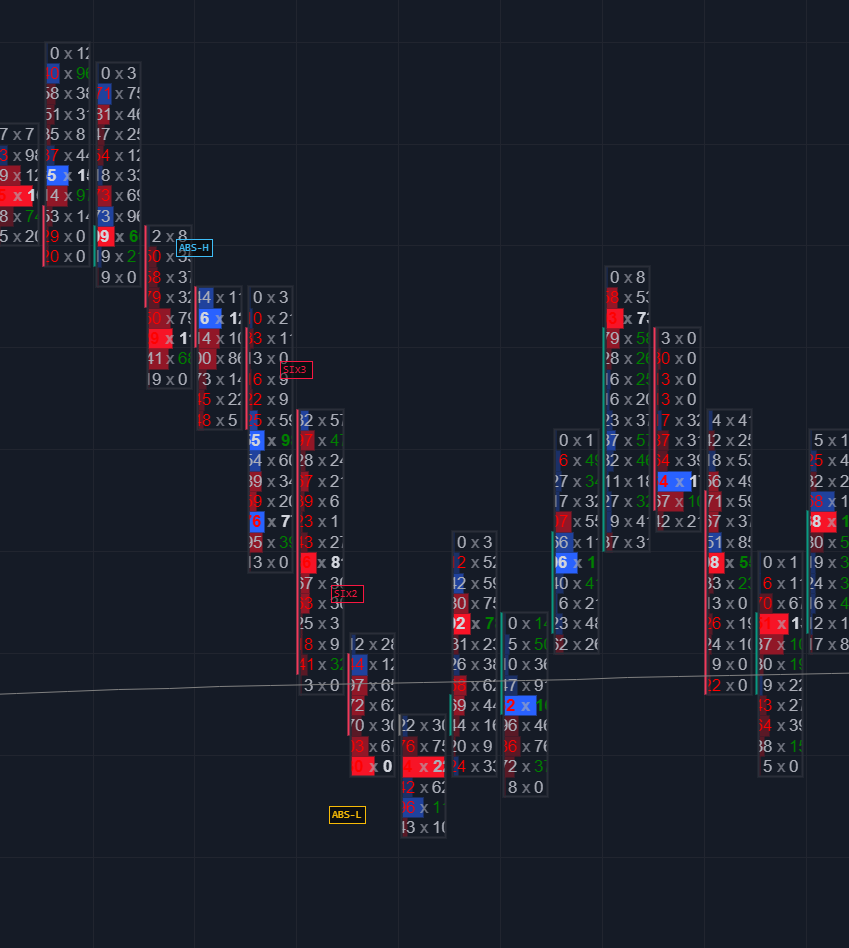
ABS-L explained (absorption at lows = bullish)
ABS-L marks absorption at the low of a bar — sellers hit the bid heavily but price closes away from the low. This often precedes long reversal entries in the 3+4 framework when other filters align.
ABS-H explained (absorption at highs = bearish)
ABS-H marks absorption at the high — buyers lift the offer but price cannot hold the high. Used to validate short reversal setups when institutions distribute into strength.
Configuration: Edge %, Min Volume, Close Reject %
- Absorption Edge % — how much of the bar range counts as the “edge” zone (default often 20–30%)
- Min Absorption Volume — minimum bid+ask volume in the edge to qualify
- Close Reject % — how far close must be from the extreme to confirm rejection
Real chart examples
On your chart, ABS markers appear in the footprint marker lane when C1–C5 pattern bars pass footprint filters. Use Full stats mode to see which candle (C1–C5) triggered absorption vs imbalance — critical for journaling and parameter tuning.